Self-hosted Grafana integration with Edge Analytics
Requirements for manual setup
- Grafana OSS 9.x.x
- Docker 20.10+ (linux)
Getting Grafana up and running (Linux only)
First install docker if you have not done so, following this.
- On a terminal you can simply type:
docker run -d -p 3000:3000 --name=grafana \
   -e "GF_PLUGINS_ALLOW_LOADING_UNSIGNED_PLUGINS=system73-3dtopology-panel,system73-3dglobe-panel" \
   -e "GF_INSTALL_PLUGINS=marcusolsson-json-datasource, https://s73-grafana-artifacts.s3.eu-west-1.amazonaws.com/3d-plugins/system73-3dtopology-panel-1.4.2.zip;system73-3dtopology-panel, \
      https://s73-grafana-artifacts.s3.eu-west-1.amazonaws.com/3d-plugins/system73-3dglobe-panel-1.2.6.zip;system73-3dglobe-panel" \
   grafana/grafana-oss:9.4.7
- Go to the browser and open the page http://localhost:3000. On the login page enter the default admin credentials User: admin, Password: admin
- For increased security Grafana prompts for setting a new admin password, please do so or skip it.
Configuring the required datasource
To integrate with the Edge Analytics API Grafana needs a plugin that is able to consume JSON APIs. There are many plugins available to do so but the plugin JSON API Data Source for Grafana is officially maintained by Grafana Labs and it perfectly covers our needs.
The plugin was already installed with the docker command.
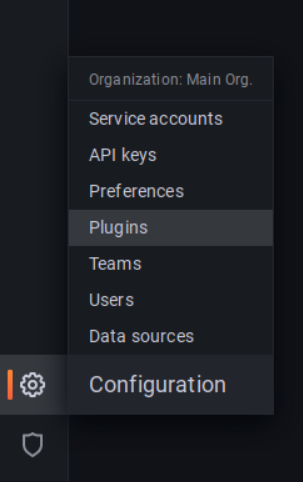
- Navigate to the Configuration > Plugins section.
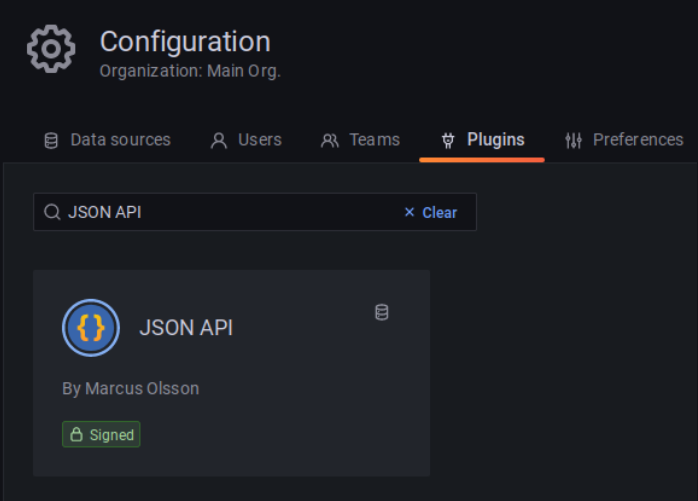
- Search for the term “JSON API”, you should select the plugin developed by Marcus Olsson.
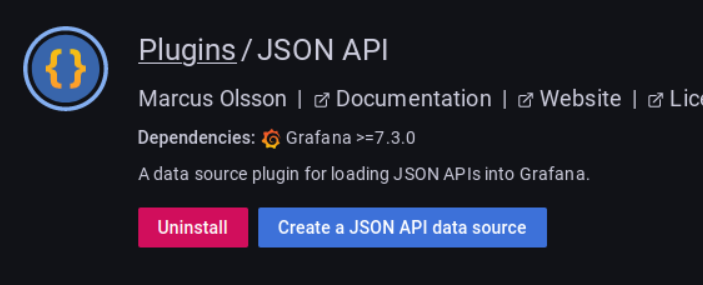
- Click on the Create a JSON API data source button.
- Configure the data source with the following values:
- Name:
System73 Analytics - URL: https://api.system73.com/analytics
-
Add a header on Custom HTTP Headers with the following:
-
Header:
Authorization -
Value: (Available on System73 Portal)
Bearer <edge_analytics_api_key>
-
- Name:
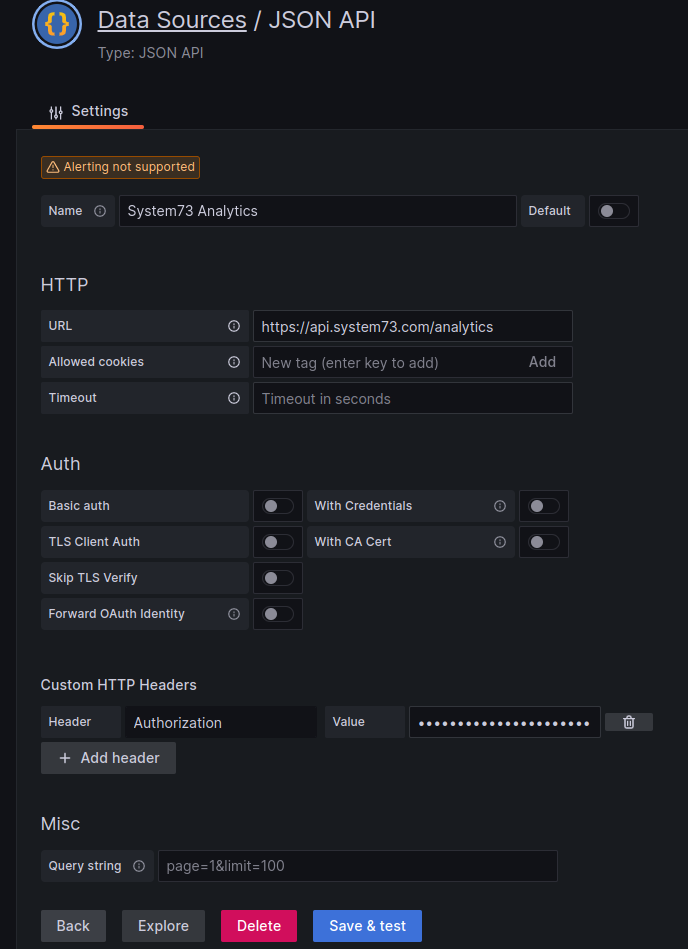 5. Click on the Save & test button (ignore the warning message) and click on the Back button.
Importing Edge Analytics dashboards
You can import the Edge Analytics dashboards that we have made available on https://github.com/System73/edge-analytics-grafana-setup:
Note
To get the benefits from the Advanced Dashboard you need to have an Edge Analytics account with the Advanced Tier enabled.
To import a dashboard:
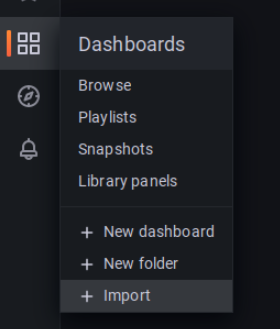
- Click on the sidebar’s Dashboards > Import
- You can either upload the dashboard file or simply copy & paste the file context. Since we are
using a container without specific host-mounted volumes it is better to simply copy its content.
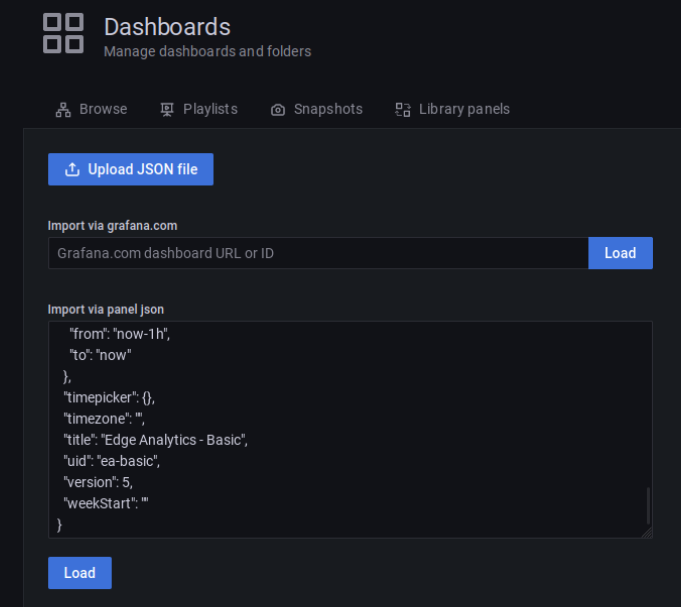
- Click on the Load button
-
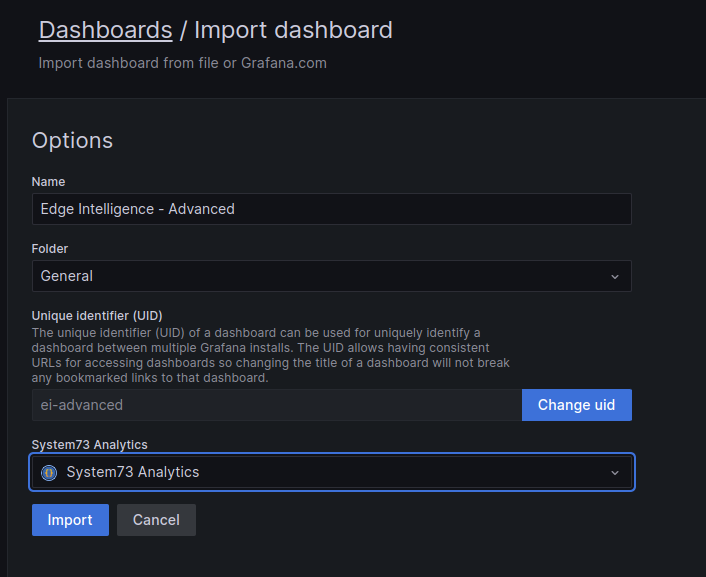
You can choose the dashboard uid, tittle, folder as you want but make sure to select the System73 Analytics as the dashboard datasource in the drop-down menu.
-
Click on the Import button
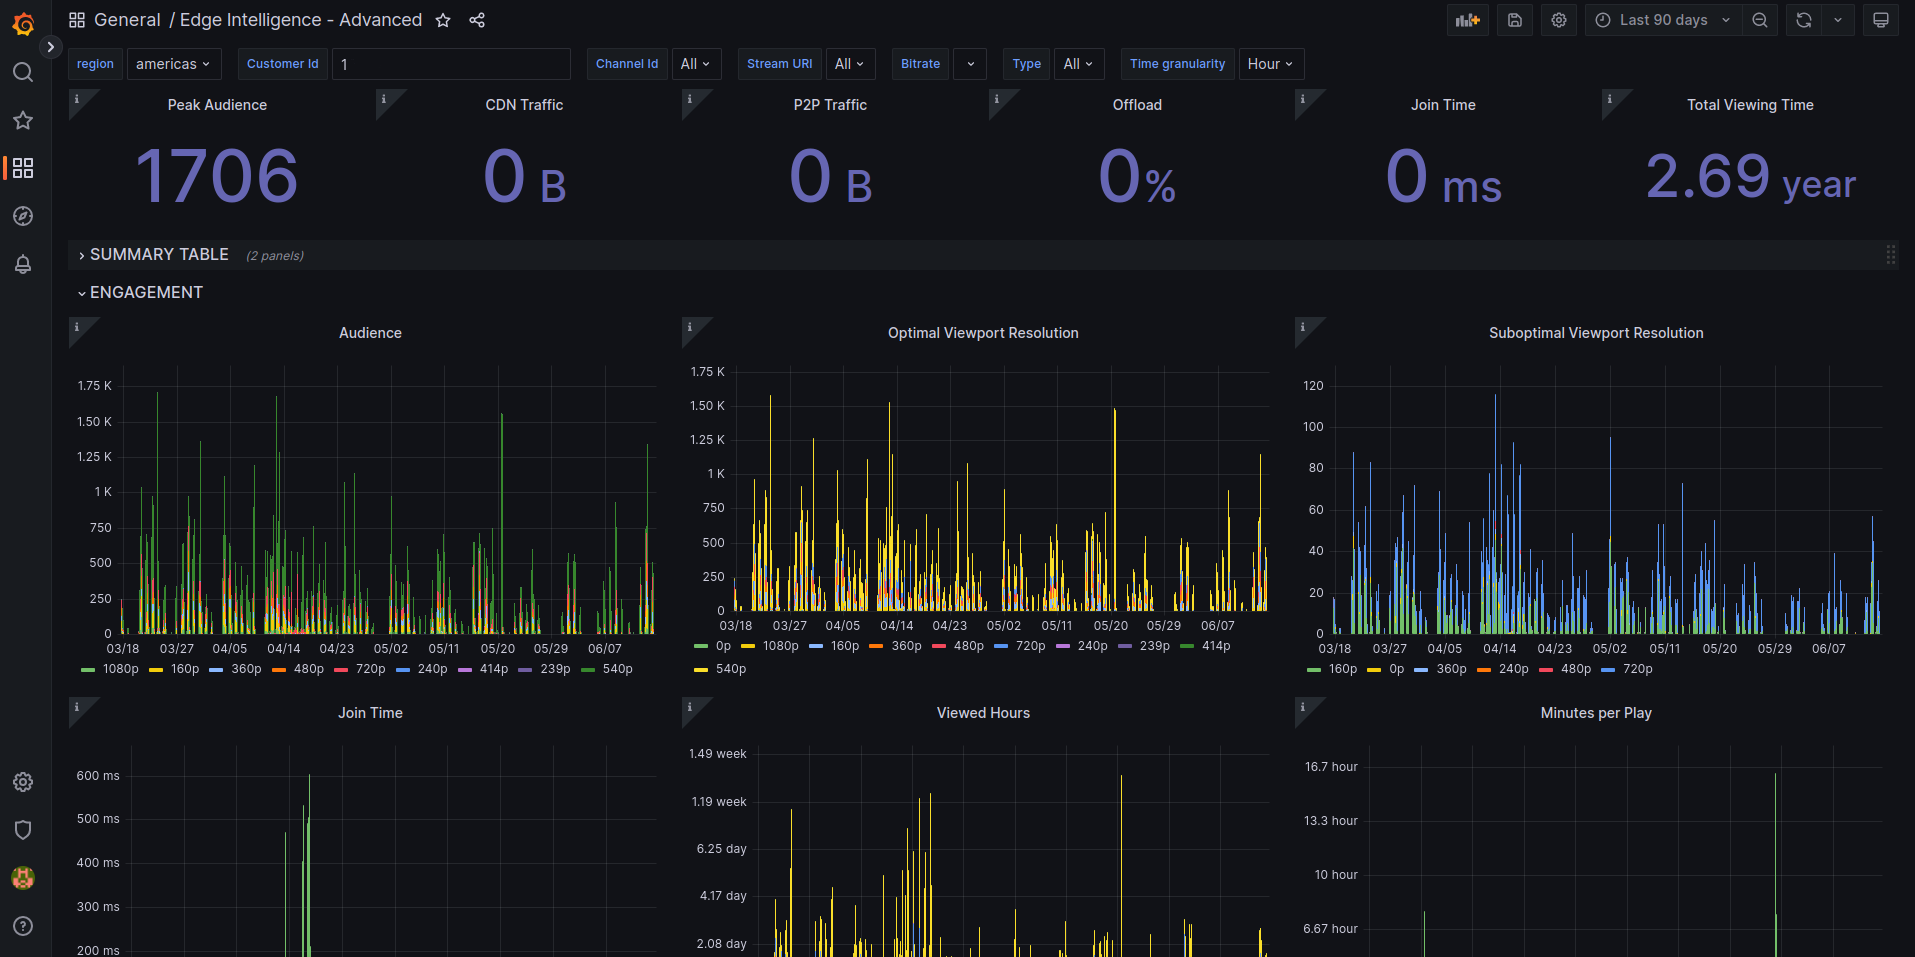
- After that you just need to select the correct region and the Edge Intelligence Id that you have
been assigned.

- Success!
Feedback
If you have any feedback or suggestions, we welcome your input!
Please open an issue using the GitHub Issues feature to share your thoughts and help us enhance the user experience.
This section was last updated 2025-02-18